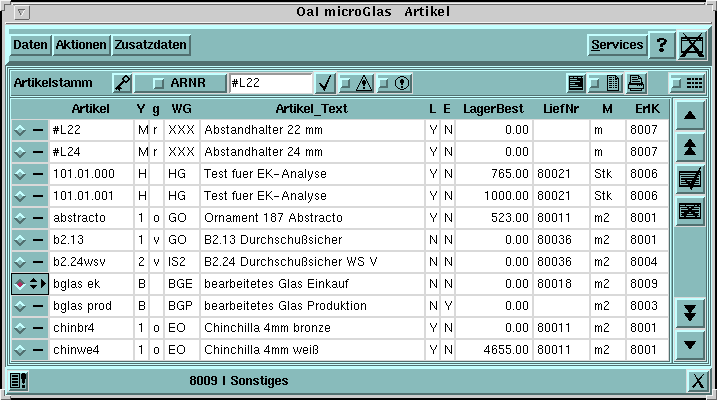
charts
- Charts are areas of presentation with more than one line in which for each line the contents of a set of data is presented. The width of the screens limits the amount of the presented fields, so only a (relevant) part of the existing data bank fields can be presented. The single columns are defined via a defining line throught the name of a data bank field to be presented. Next to the values of those data bank fields, values from internal so-called association arrays can be presented as well.
Charts are often used for a quick selection of a set of data. If the corresponding mask is active next to the chart (mask via the same data bank chart), the mor4e4 often more enlarged presen4tation of data of this set of data is active automatically in addition to the active set of data of the chart (the presentation of the mask "follows" the active set of data of the chart).

The layout of the grids (also called "chart layout") get a name which is typically denominates the purpose of its use. In application system, charts denominated differently can exist and if need be, be activated next to each other and at the same time (see program and configuration).
